
Running It Hot
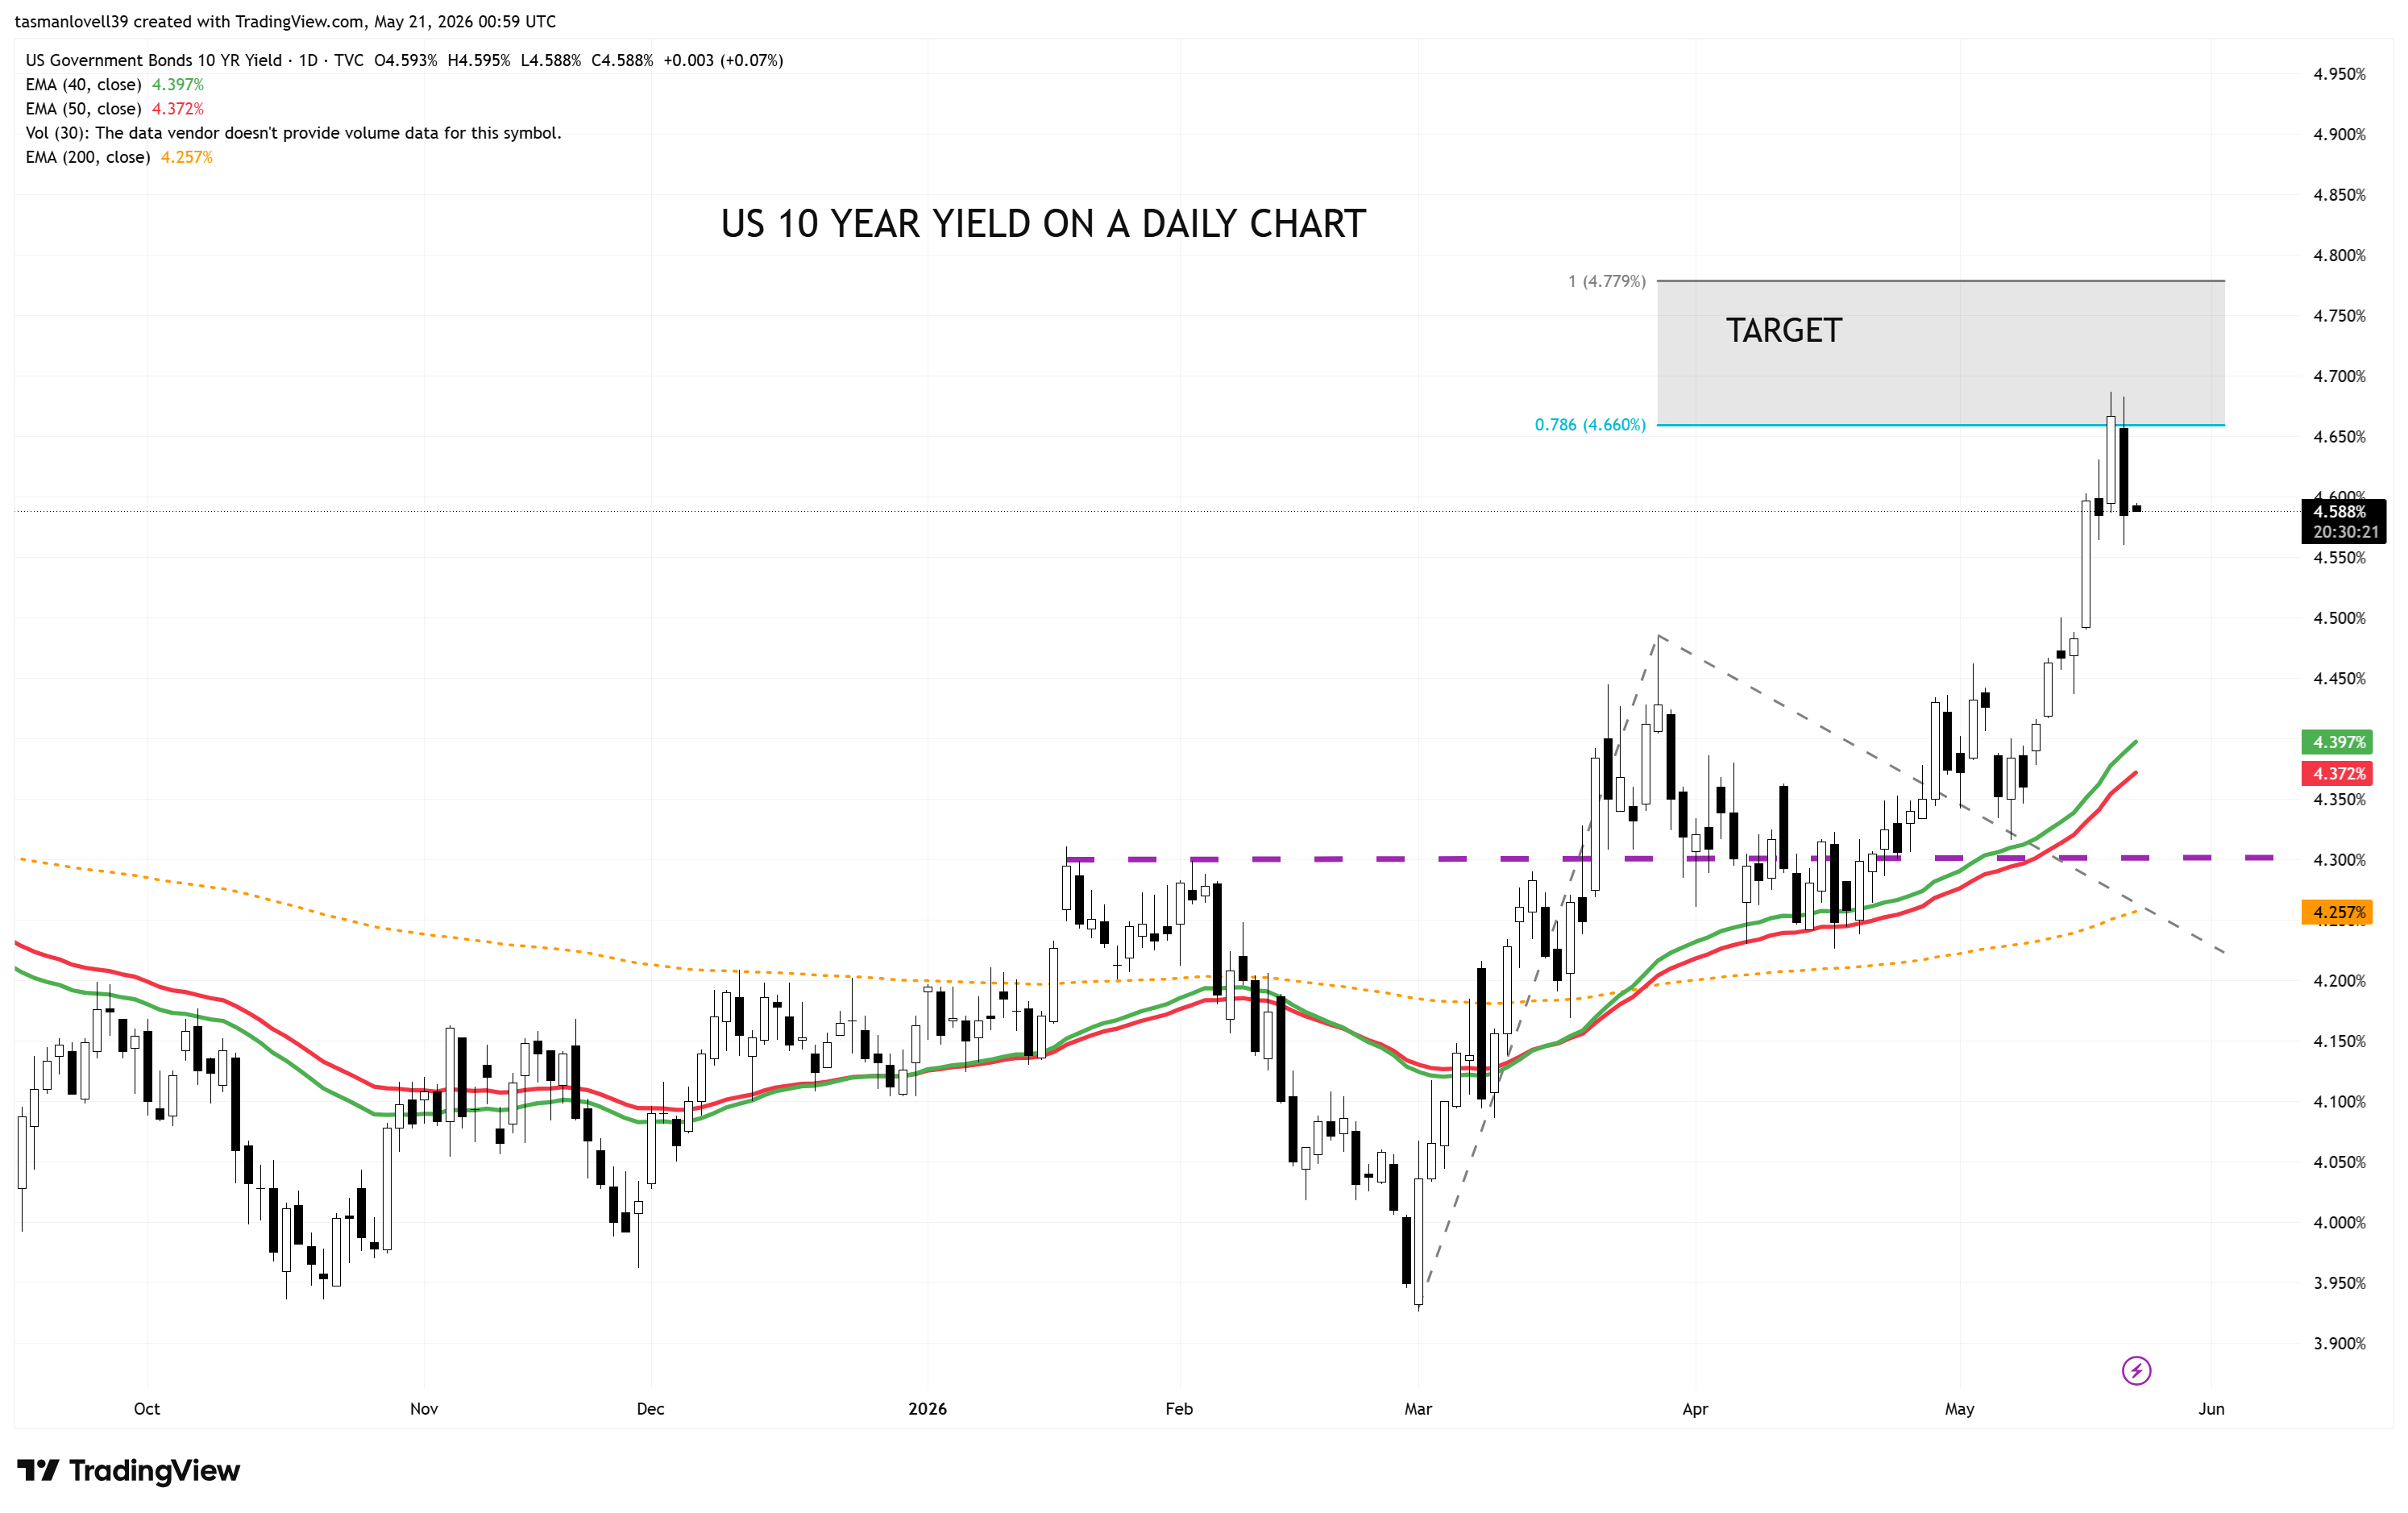
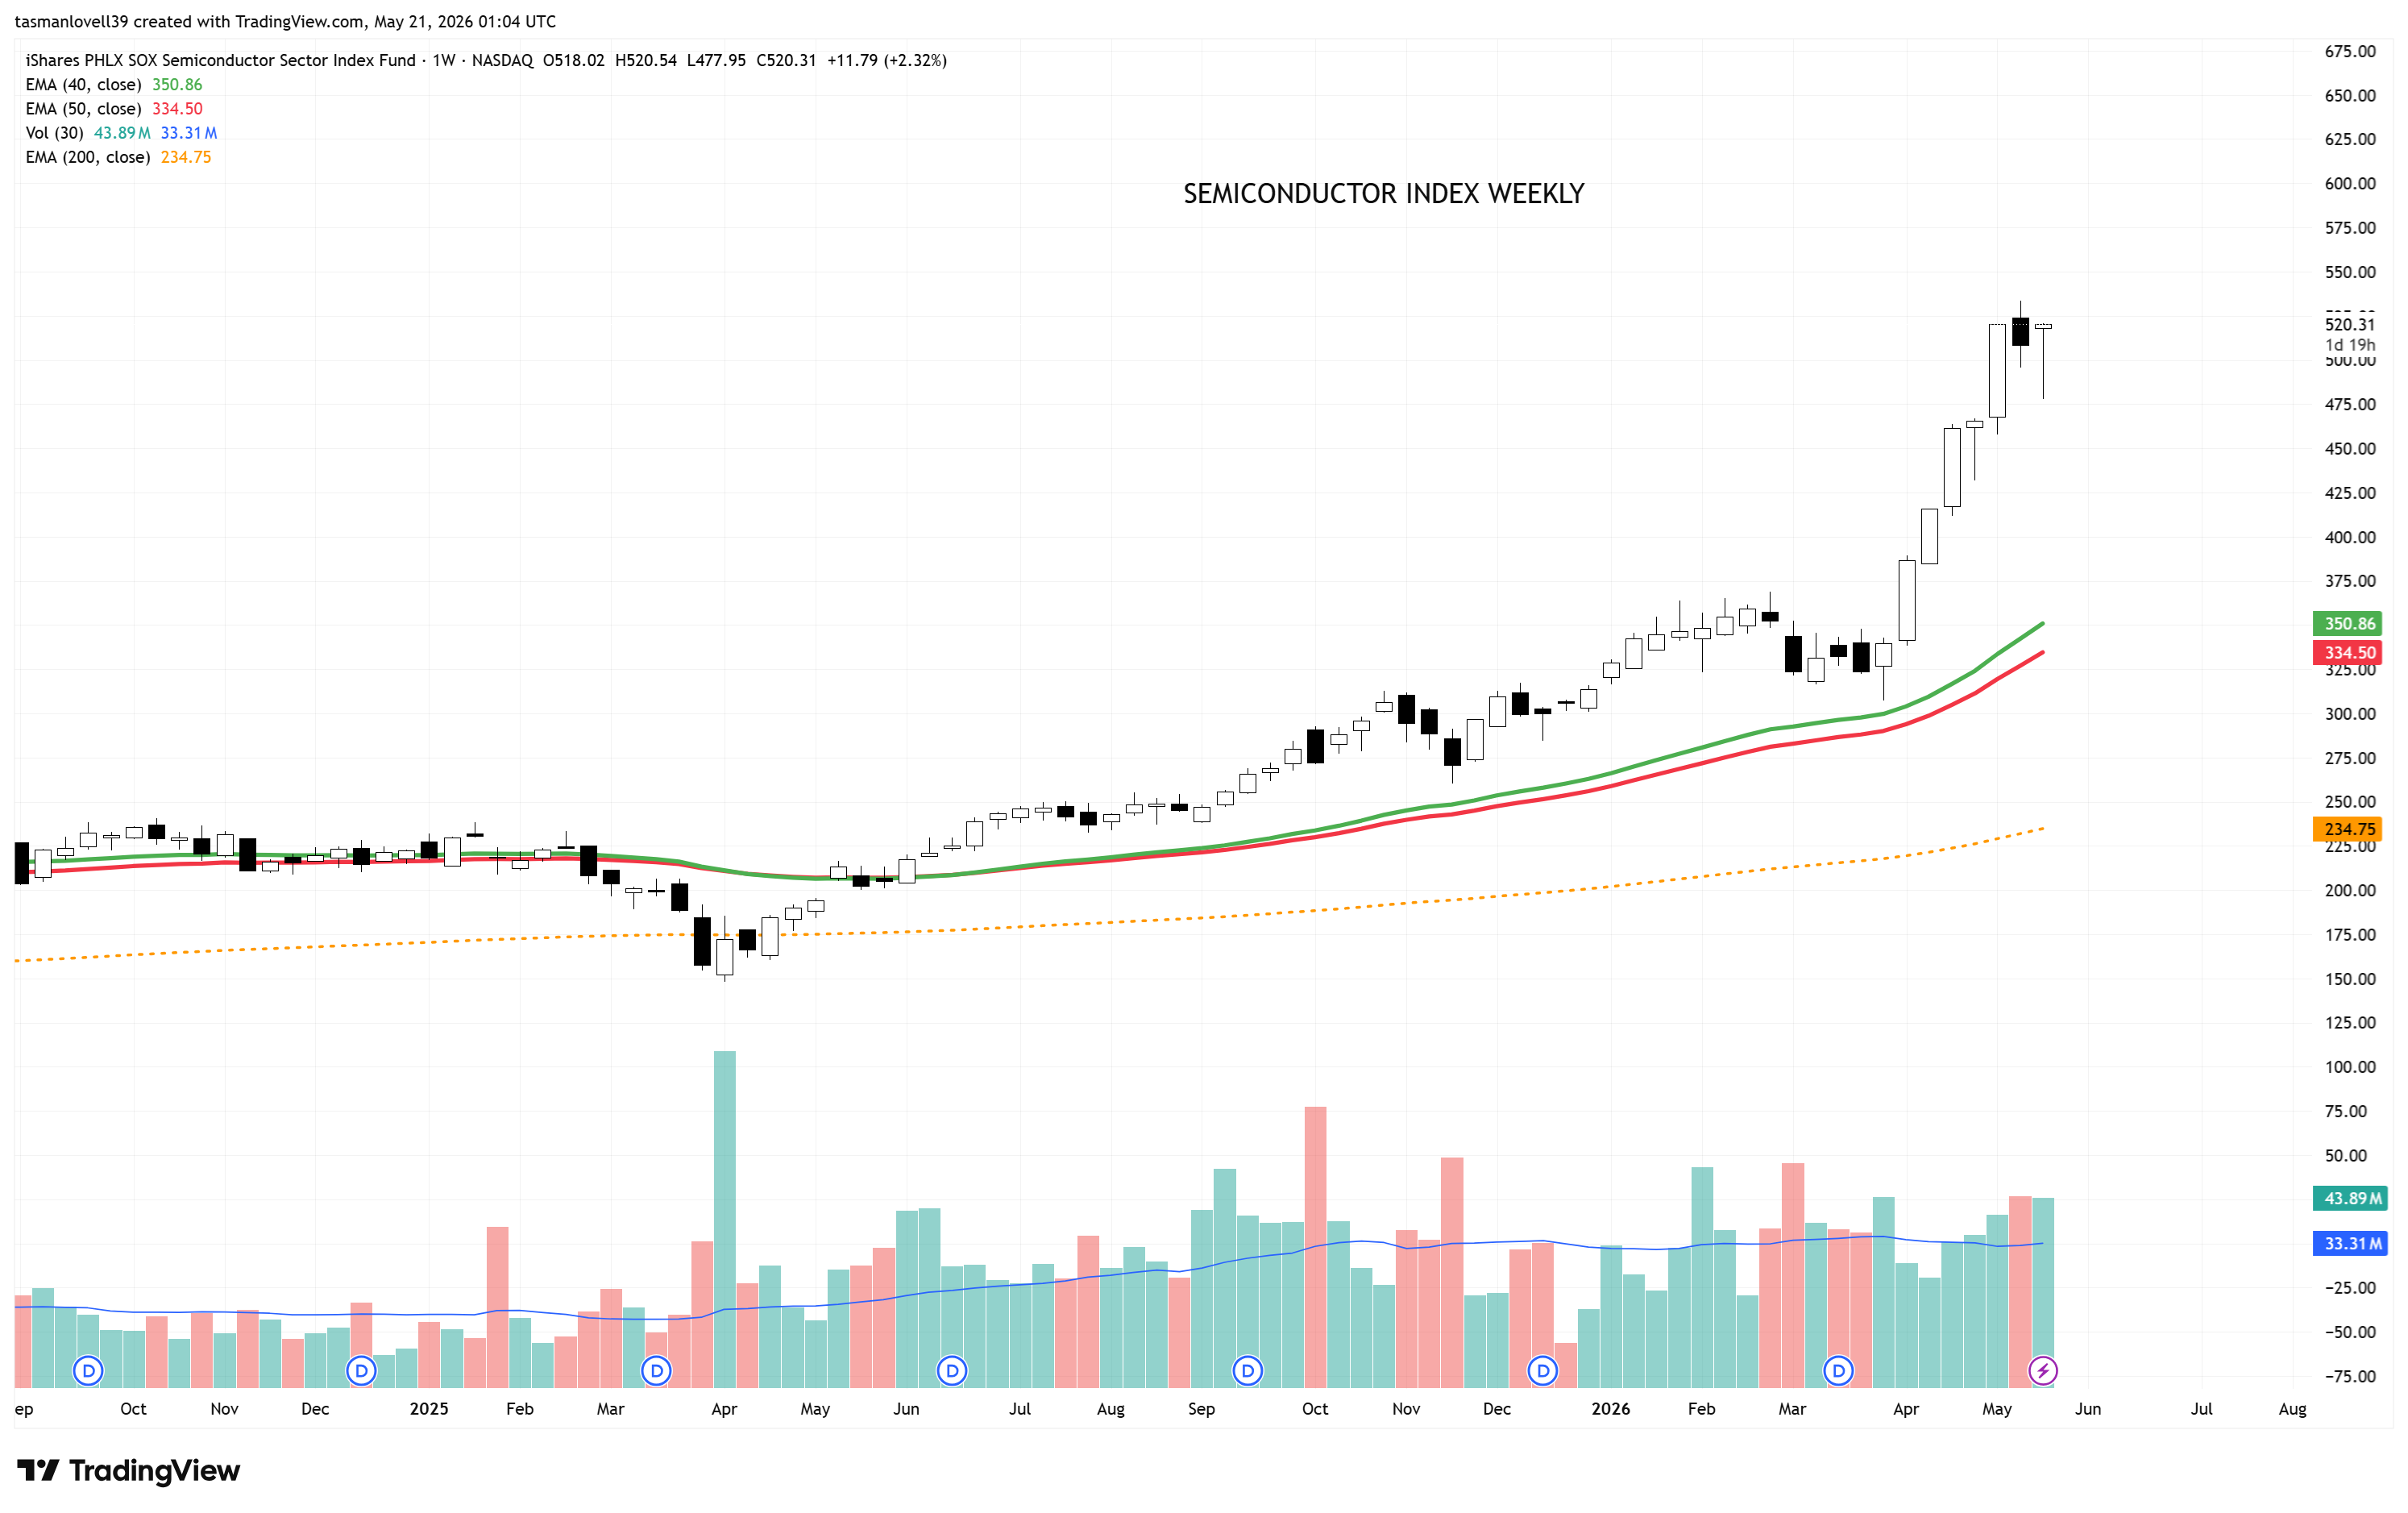
The fiscal system increasingly needs inflation, rising asset prices, and strong nominal growth simply to keep the debt math stable. US 10 YEARS , SOXX and GOLD.

It’s that time of the month again where I look through the latest Monthly Treasury Statement.
For newer subscribers, macro strategist Luke Gromen introduced me to the concept of “True Interest Expense”. The idea is simple:
Take the combined cost of: Social Security, Medicare, Health, Net Interest and Veterans’ Benefits. Then divide that number by total government receipts.
In other words: How much of every dollar collected by the government is already consumed before discretionary spending even begins?
The US fiscal year runs from 1st October to 30th September, and for FY2025 the numbers looked like this: Social Security: $1.58tn Medicare: $997bn Health: $979bn Net Interest: $970bn Veterans’ Benefits: $377bn
That brings total “True Interest Expense” to roughly $4.9 trillion against total government receipts of $5.24 trillion.
The result? Around 94 cents of every dollar collected by the US government last fiscal year went toward those five categories alone, leaving very little room for big-ticket discretionary spending items like defence, infrastructure, education, or any meaningful recession response without substantially larger deficits.
That is the fiscal dominance right there.
So What Changed This Year?
The latest Treasury Statement gives us the fiscal year-to-date numbers through April 2026.
So far: “True Interest Expense” has totaled roughly $2.98tn Receipts have totaled roughly $3.32tn The ratio has improved slightly to ~89.8%

Credit where credit is due, that is an improvement.
However, the reason for the improvement matters.
April is the government’s big tax collection month. Final prior-year tax payments hit Treasury, along with quarterly estimated tax payments. Individual income tax receipts exploded to $515bn in April alone, compared to just $133bn in February and $189bn in March.
That seasonal tax surge temporarily boosted receipts and created a rare monthly surplus.
And the volatility underneath the YTD average is striking. February alone saw True Interest Expense hit roughly 130% of monthly receipts. April flipped it the other way. The ~90% YTD figure is the smoothed result of those swings, not a steady trend line. Strip April out and the picture looks materially worse.
But underneath the surface, the structural trend remains intact.
The Debt Is Beginning To Compound In Reverse
The most important line item in the entire report may be net interest expense itself.
In FY2025:total net interest expense was $970bn averaging roughly $81bn per month.
So far in FY2026: net interest expense has already reached $616bn through just seven months, averaging roughly $88bn per month.
April alone came in at $97bn.
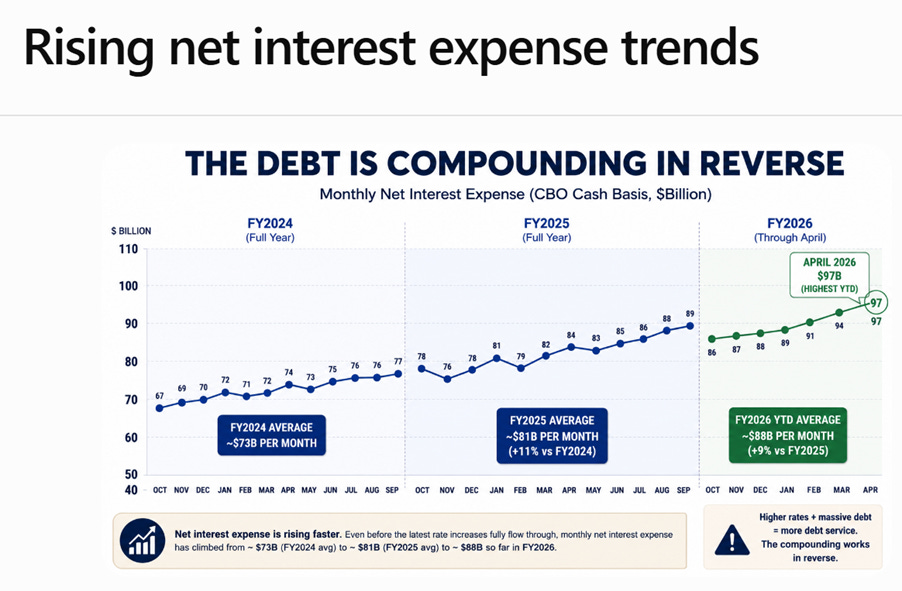
Meanwhile, the US 10-year yield has broken sharply higher again, 65 basis points higher than several months ago.
This is the compounding effect now visible at monthly resolution. Trillions of dollars issued during the zero-rate era continue rolling over into a much higher-rate environment. Every refinancing cycle locks in a larger future interest burden, which itself then requires additional issuance to fund. The dynamic is not new. What is new is the speed at which it now shows up in the monthly print.
The Hamster Wheel Keeps Spinning

This is why I keep coming back to the “run it hot” scenario.
The system increasingly needs: strong nominal GDP, inflation, rising asset prices, elevated tax receipts, and now tariff revenues, just to stop the fiscal math deteriorating further.
The reason the “True Interest Expense” ratio has improved this year is because receipts are currently growing faster than the expense basket itself.
Average monthly receipts have moved from roughly $436bn in FY2025 to roughly $474bn so far in FY2026, growth of almost 9%. But the same caveat applies as above. April’s $515bn print is doing a lot of the work in that average. Compare the first six months of each fiscal year on a like-for-like basis and the growth rate is more modest. The headline still tells the right story directionally, receipts are outpacing the expense basket, but the gap is narrower than the YTD figures alone suggest.
Meanwhile, the “True Interest Expense” basket itself is growing at closer to 4–5%.
So what is driving receipts higher? Partly, an economy that continues outperforming expectations.
But also because asset prices have exploded higher since the start of this fiscal year. The Nasdaq is up strongly, the Semiconductor Index has gone vertical, and elevated equity prices continue feeding through into capital gains, stock options, bonuses, and tax receipts.
That is the key point.
The system currently still works as long as nominal growth, asset prices, and liquidity conditions remain strong enough to outrun the compounding interest burden underneath.
Like a hamster on a wheel, the system needs to keep accelerating simply to avoid being thrown off.
Because if growth slows materially: tax receipts weaken, deficits widen, issuance rises, while interest expense continues compounding mechanically in the background.
That is the trap.
The April surplus may look comforting on the surface, but structurally the system still appears heavily dependent on keeping nominal growth and liquidity conditions elevated.
As long as the “True Interest Expense” ratio keeps drifting lower, Bessent and Trump can argue they are inflating their way out of the debt trap in an orderly fashion.
But the man or woman on the street probably will not feel great about it, because purchasing power continues getting eroded in the process. In that environment, you increasingly need to own assets simply to keep up.
It’s when the hamster eventually gets thrown off the wheel that gold will truly come into its own again.
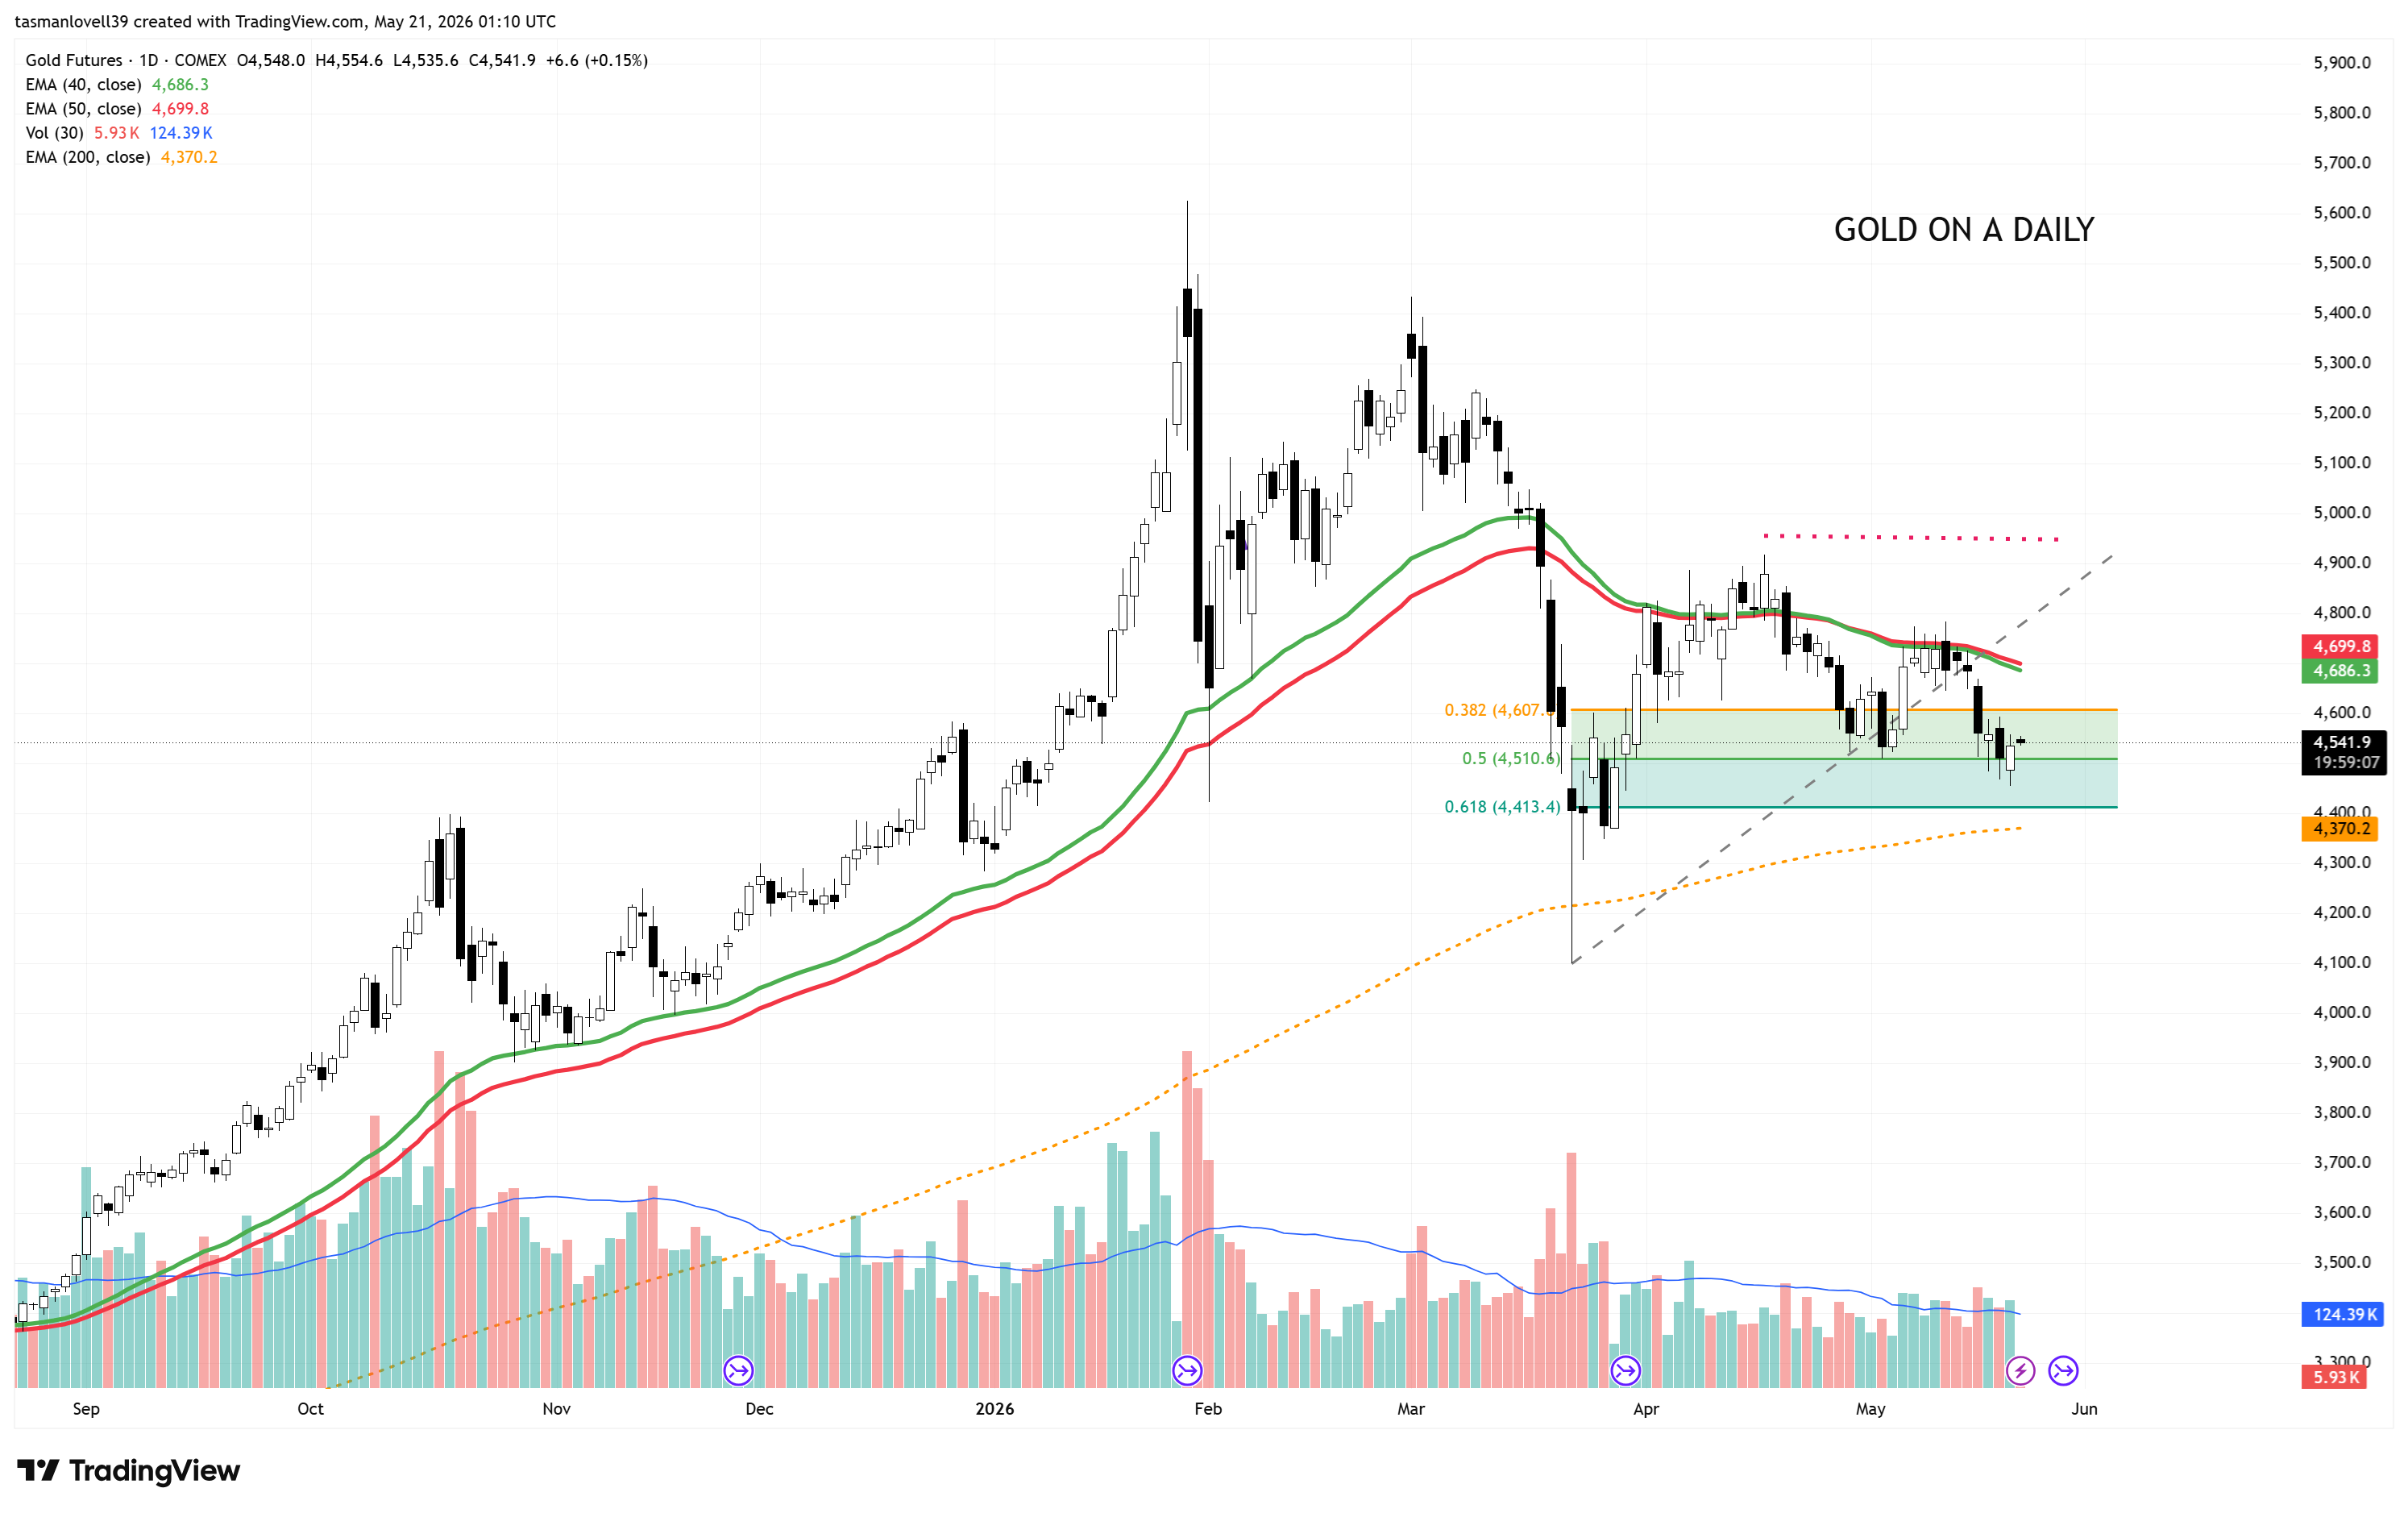
For now, gold is still hanging in there. It got down to 4455 this week before bouncing, meaning the key 4400 level has held. However, it is still trading below its declining 50-day EMA, and it really needs to reclaim that level before I can say we are back in the clear.
Have a great day !
Stay Sharp
Disclaimer: This Isn’t Investment Advice, It’s a perspective, not a License to Trade (see full disclaimer at the end, if you make it that far!)
P.S. If you enjoy these posts, please give it a like and share it.
https://tasmanlovell39.substack.com/publish/home
Disclaimer: This Isn’t Investment Advice, It’s a perspective, not a License to Trade
The Lovell Bull Bear Report is an independent publication intended for informational and educational purposes only. It reflects the views, observations, and occasional battle scars of a market participant, not personalized investment advice. Any opinions, charts, or trade ideas shared here are general in nature and not tailored to your individual financial situation, risk tolerance, or emotional constitution.
Markets are unpredictable beasts, and while we strive for clarity and conviction, we cannot guarantee accuracy, completeness, or future results. Investing involves risk, sometimes a lot of it, and past performance is no guarantee of future outcomes. You should do your own research (or consult a licensed advisor) before acting on anything you read here.
Tom Lovell, its publisher, and any related parties accept no liability for losses, financial, emotional, or otherwise, that may result from decisions based on this content. We may hold positions in securities mentioned, and those positions may change without notice. Nothing in this note constitutes a solicitation, offer, or recommendation to buy or sell any financial instrument.
In short: read wisely, act carefully, always respect your stops, and remember, by the time you read this, the market may have already moved.